


ETFGI, a leading independent research and consultancy firm covering trends in the global ETF/ETP ecosystem, reported today that ETFs and ETPs listed Globally gathered net inflows of US$17.35 billion in January. Assets invested in the Global ETF/ETP industry finished the month up 7.13%, from US$4.82 trillion at the end of December, to US$5.16 trillion, according to ETFGI's January 2019 Global ETF and ETP industry landscape insights report, an annual paid-for research subscription service. (All dollar values in USD unless otherwise noted.)
Highlights
- Assets invested in the Global ETF/ETP industry rise 7.13% in January.
- During January 2019, ETFs/ETPs listed Globally attracted $17.35 Bn in net inflows.
- SPY US, arguably the most famous ETF listed, celebrated its 26th anniversary on 22nd Jan.
“In January, equity markets rebounded from the Q4 when global equities suffered steep declines amid persistent worries over trade and economic growth. Fed chair Powell revised his stance on where he believes the neutral rate of interest lies, easing fears of a dramatic and painful tightening cycle. Energy’s decline during the Q4 rout subdued inflation in developed economies taking hiking pressure off central banks while provided stimulus to consumers and businesses, giving stronger core metrics. The S&P 500 finished January up 8.01%, the best January since 1987, while the S&P Topix 150 gained 7.26% and the S&P Europe 350 gained 6.23%. Emerging and Frontier markets were up 7.77% and 4.61% respectively, hampered by dollar strength.” according to Deborah Fuhr, managing partner and founder of ETFGI.
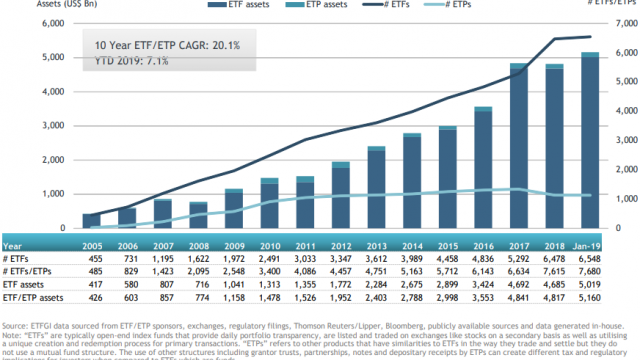
By the end of January 2019, the Global ETF/ETP industry had 7,680 ETFs/ETPs, from 408 providers listed on 71 exchanges in 57 countries. Following net inflows of US$17.35 Bn and market moves during the month, assets invested in the Global ETF/ETP industry increased by 7.13% from $4.82 Tn at the end of December, to $5.16 Tn.
Growth in Global ETF and ETP assets as of the end of January 2019

Equity ETFs/ETPs listed Globally saw net outflows of $8.83 Bn in January 2019 while equity ETFs/ETPs gathered net inflows of $88.45 Bn in January 2018. Fixed income ETFs/ETPs listed Globally attracted net inflows of $23.66 Bn in January, which is considerably greater than the $11.07 Bn in net inflows fixed income products gathered in January 2018.
Substantial inflows can be attributed to the top 20 ETF's by net new assets, which collectively gathered $32.55 Bn in January, the iShares Core MSCI Emerging Markets ETF (IEMG US) gathered $4.24 Bn alone.
Top 20 ETFs by net new assets January 2019: Global
|
Name |
Ticker |
Assets |
NNA |
NNA |
|
iShares Core MSCI Emerging Markets ETF |
SHY US |
57,728 |
4,236 |
4,236 |
|
Vanguard Short-Term Corporate Bond ETF |
SHV US |
23,505 |
3,032 |
3,032 |
|
Vanguard Intermediate-Term Corporate Bond ETF |
AGG US |
21,300 |
2,647 |
2,647 |
|
TOPIX Exchange Traded Fund |
IWD US |
77,463 |
2,211 |
2,211 |
|
iShares MSCI Emerging Markets ETF |
IVV US |
33,348 |
1,882 |
1,882 |
|
iShares Edge MSCI USA Quality Factor ETF |
CPSEBE IN |
9,139 |
1,756 |
1,756 |
|
iShares J.P. Morgan USD Emerging Markets Bond ETF |
BSV US |
16,579 |
1,699 |
1,699 |
|
Vanguard S&P 500 ETF |
IWB US |
99,406 |
1,599 |
1,599 |
|
iShares MBS ETF |
1306 JP |
13,919 |
1,497 |
1,497 |
|
SPDR Bloomberg Barclays High Yield Bond ETF |
VEA US |
8,584 |
1,485 |
1,485 |
|
iShares 7-10 Year Treasury Bond ETF |
VTI US |
11,671 |
1,433 |
1,433 |
|
iShares 20+ Year Treasury Bond ETF |
ACWI US |
10,130 |
1,294 |
1,294 |
|
Vanguard Total Stock Market ETF |
BIL US |
102,788 |
1,103 |
1,103 |
|
iShares iBoxx $ Investment Grade Corporate Bond ETF |
USMV US |
31,731 |
1,085 |
1,085 |
|
iShares MSCI USA Minimum Volatility ETF |
ACWX US |
21,172 |
1,041 |
1,041 |
|
iShares Core S&P Small-Cap ETF |
EFA US |
42,269 |
993 |
993 |
|
iShares US Treasury Bond ETF |
1305 JP |
7,952 |
991 |
991 |
|
Communication Services Select Sector SPDR Fund |
SDY US |
4,089 |
983 |
983 |
|
WisdomTree Floating Rate Treasury Fund |
1308 JP |
2,018 |
842 |
842 |
|
PIMCO US Dollar Short Maturity ETF |
MUB US |
3,153 |
736 |
736 |

The top 10 ETP's by net new assets collectively gathered $4.01 Bn in January, the SPDR Gold Shares (GLD US) gathered $1.51 Bn.
Top 10 ETPs by net new assets January 2019: Global
|
Name |
Ticker |
Assets |
NNA |
NNA |
|
SPDR Gold Shares |
GLD US |
34,069 |
1,514 |
1,514 |
|
iShares Gold Trust |
IAU US |
12,442 |
511 |
511 |
|
ETFS Physical Gold |
PHAU LN |
7,292 |
406 |
406 |
|
Xetra Gold EUR |
4GLD GY |
8,050 |
337 |
337 |
|
iPath Series B S&P 500 VIX Short-Term Futures ETN |
VXXB US |
419 |
280 |
280 |
|
VelocityShares Daily 3x Long Natural Gas ETN |
UGAZ US |
493 |
265 |
265 |
|
ProShares Ultra VIX Short-Term Futures |
UVXY US |
322 |
244 |
244 |
|
Invesco CurrencyShares Japanese Yen Trust |
FXY US |
417 |
240 |
240 |
|
VelocityShares Daily 2x VIX Short Term ETN |
TVIX US |
362 |
109 |
109 |
|
SPDR Gold MiniShares Trust |
GLDM US |
518 |
106 |
106 |
Investors have tended to invest in fixed income, and emerging market ETFs in January.

