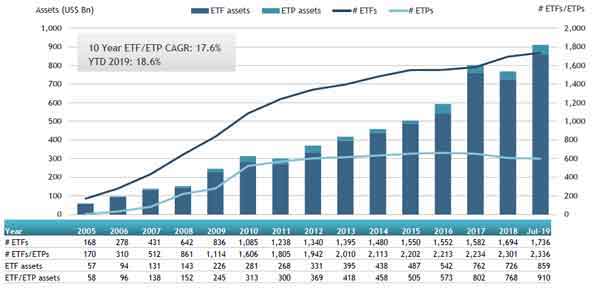
ETFGI, a leading independent research and consultancy firm covering trends in the global ETF/ETP ecosystem, reported today that ETFs and ETPs listed in Europe gathered net inflows of US$18.55 billion in July, bringing year-to-date net inflows to US$62.74 billion. Assets invested in the European ETF/ETP industry have increased by 1.1%, from US$900.66 billion at the end of June, to US$910.34 billion, according to ETFGI's July 2019 European ETF and ETP industry landscape insights report, an annual paid-for research subscription service. (All dollar values in USD unless otherwise noted.)
At the end of July 2019, the European ETF/ETP industry had 2,336 ETFs/ETPs, from 68 providers listed on 30 exchanges in 23 countries.
Highlights
- Assets invested in the European ETF/ETP industry reach an all-time high of $910.34 Bn.
- July marks the 58th consecutive month of flows into European listed products.
- Assets invested in the European ETF/ETP industry increased by 1.1% in July.
- During July 2019, ETFs/ETPs listed in Europe saw $18.55 Bn in net inflows.
“Despite the weak performance for European equity markets and the intensified trade dispute between US/China, the prospects for further loosening in monetary policy by FED and ECB led the European Equity ETF/ETPs to see significant inflows of US$9.97 Bn in July, and Fixed Income funds see net inflows of US$6.57 Bn” , according to Deborah Fuhr, managing partner and founder of ETFGI.
Europe ETF and ETP asset growth as at the end of July 2019

Equity ETFs/ETPs listed in Europe saw considerable net inflows of $9.97 Bn in July 2019, bringing net inflows for 2019 to $16.67 Bn, substantially less than the $24.51 Bn in net inflows equity products had attracted by the end of July 2018. Fixed income ETFs/ETPs listed in Europe attracted net inflows of $6.57 Bn in July, bringing net inflows for 2019 to $38.33 Bn, considerably greater than the
$8.48 Bn in net inflows fixed income products had attracted by the end of July 2018.
Substantial inflows can be attributed to the top 20 ETF’s by net new assets, which collectively gathered $13.35 Bn in July, the UBS ETFs plc - MSCI ACWI SF UCITS ETF (hedged to USD) A-acc (ACWIU SW) gathered $1.54 Bn alone.
Top 20 ETFs by net new assets July 2019: Europe
|
Name |
Ticker |
Assets |
NNA |
NNA |
|
UBS ETFs plc - MSCI ACWI SF UCITS ETF (hedged to USD) A-acc |
ACWIU SW |
2304.62 |
1,364.95 |
1538.42 |
|
UBS ETFs plc - MSCI ACWI SF UCITS ETF (hedged to CHF) A-acc |
ACWIS SW |
1917.61 |
1,179.75 |
1373.46 |
|
iShares € High Yield Corp Bond UCITS ETF |
IHYG LN |
9483.22 |
3,856.16 |
1309.72 |
|
UBS ETFs plc - MSCI ACWI SF UCITS ETF (hedged to EUR) A-acc |
ACWIE SW |
2047.33 |
1,117.24 |
1191.86 |
|
iShares Core € Corp Bond UCITS ETF |
IEBC LN |
13403.46 |
4,758.32 |
1152.99 |
|
Invesco MSCI Saudi Arabia UCITS ETF |
MSAU LN |
2364.61 |
2,255.20 |
1150.49 |
|
iShares USD Treasury Bond 0-1yr UCITS ETF - Acc |
IB01 LN |
1525.44 |
1,523.15 |
1106.56 |
|
iShares J.P. Morgan $ EM Bond UCITS ETF |
SEMB LN |
8895.35 |
1,956.27 |
742.81 |
|
iShares STOXX Europe 600 UCITS ETF (DE) |
SXXPIEX GY |
6637.08 |
(91.62) |
578.17 |
|
PIMCO Euro Short Maturity ETF |
PJS1 GY |
2689.77 |
250.62 |
412.29 |
|
iShares S&P 500 UCITS ETF |
IUSA LN |
9339.63 |
285.00 |
334.18 |
|
Invesco US Treasury 7-10 Year UCITS ETF GBP Hdg Dist |
TRXS LN |
1363.47 |
1,398.60 |
332.48 |
|
iShares Core MSCI World UCITS ETF |
IWDA LN |
18430.22 |
2,027.34 |
331.21 |
|
iShares $ High Yield Corp Bond UCITS ETF |
IHYU LN |
3437.67 |
726.11 |
321.44 |
|
iShares $ Corp Bond UCITS ETF |
LQDE LN |
4937.17 |
(594.71) |
270.31 |
|
Xtrackers Equity Low Beta Factor UCITS ETF (DR) - 1C |
XDEB GY |
425.97 |
265.32 |
258.13 |
|
iShares EURO STOXX 50 UCITS ETF |
EUN2 GY |
4495.17 |
(638.95) |
244.94 |
|
AMUNDI ETF S&P 500 UCITS ETF USD D |
500USD SW |
2217.62 |
665.56 |
235.22 |
|
iShares S&P 500 Health Care Sector UCITS ETF |
IHCU LN |
1348.90 |
159.30 |
232.95 |
|
iShares MSCI Europe ex-UK UCITS ETF |
IEUX LN |
1609.33 |
(621.07) |
231.02 |
Top 10 ETPs by net new assets July 2019: Europe
|
Name |
Ticker |
Assets |
NNA |
NNA |
|
ETFS Physical Silver |
PHAG LN |
1225.55 |
374.47 |
318.32 |
|
iShares Physical Gold ETC |
SGLN LN |
5821.02 |
983.71 |
233.29 |
|
ETFS Brent Crude |
BRNT LN |
316.69 |
22.47 |
223.79 |
|
Amundi Physical Metals PLC |
GOLD FP |
491.15 |
470.42 |
165.13 |
|
Xtrackers Physical Gold Euro Hedged ETC |
XAD1 GY |
2191.95 |
206.37 |
155.42 |
|
Xtrackers Physical Silver ETC (EUR) |
XAD6 GY |
319.70 |
196.29 |
135.39 |
|
Xtrackers Physical Gold ETC (EUR) |
XAD5 GY |
3013.86 |
198.02 |
130.87 |
|
ETFS Physical Swiss Gold |
SGBS LN |
2134.19 |
1,222.57 |
125.79 |
|
GBS Bullion Securities |
GBS LN |
3596.78 |
(64.91) |
58.76 |
|
ETFS Physical Platinum |
PHPT LN |
333.38 |
91.11 |
23.74 |
Investors have tended to invest in Equity and Fixed Income ETFs/ETPs in July.


