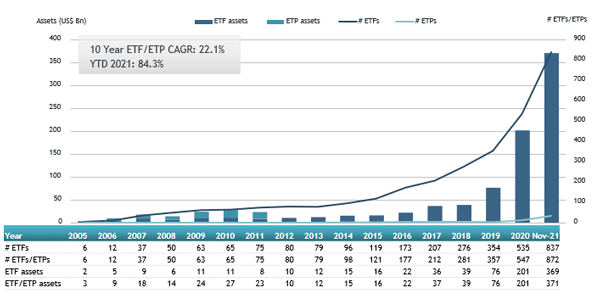
ETFGI, a leading independent research and consultancy firm covering trends in the global ETFs/ETPs ecosystem, reported today that the assets invested in Environmental, Social, and Governance (ESG) ETFs and ETPs listed globally reach a record US$371 billion at the end of November. ESG products gathered net inflows of US$16.63 billion during November, bringing year-to-date net inflows to US$146.84 billion which is much higher than the US$68.59 billion gathered at this point last year. Total assets invested in ESG ETFs and ETPs increased by 2.3% from US$362 billion at the end of October 2021 to US$371 billion, according to ETFGI’s November 2021 ETF and ETP ESG industry landscape insights report, an annual paid-for research subscription service. (All dollar values in USD unless otherwise noted.)
Highlights
-
Assets of $371 billion invested in ETFs and ETPs listed globally at the end of November are the highest on record.
-
Record YTD 2021 net inflows of $146.84 Bn beating the prior record of $68.59 Bn gathered in YTD 2020.
-
$146.84 Bn YTD net inflows are $59.98 Bn over full year 2020 record net inflows $86.86 Bn.
-
$165.11 billion in net inflows gathered in the past 12 months.
-
Assets increased 84.3% YTD in 2021, going from US$201 billion at end of 2020, to US$371 billion.
-
35th month of consecutive net inflows.
-
Equity ETFs and ETPs listed globally gathered a record $111.40 Bn in YTD net inflows 2021.
“Due to the growing threat of a new COVID variant Omicron, the S&P 500 declined 0.69% in November, however, the index is up 23.18% year to date. Developed markets, excluding the US, experienced a fall of 4.94% in November. Israel (down 1.03%) and the US (down 1.47%) experienced the smallest losses among the developed markets in November, while Luxembourg suffered the biggest loss of 16.90%. Emerging markets declined 3.53% during November. United Arab Emirates (up 8.15%) and Chile (up 5.51%) gained the most, whilst Turkey (down 13.72%) and Poland (down 11.95%) witnessed the largest declines.” According to Deborah Fuhr, managing partner, founder and owner of ETFGI.
Global ESG ETF and ETP asset growth as at end of November 2021

The Global ESG ETF/ETP category had 872 products, with 2,468 listings, assets of $371 Bn, from 177 providers listed on 40 exchanges in 32 countries.
Since the launch of the first ESG ETF/ETP in 2002, the iShares MSCI USA ESG Select ETF, the number and diversity of products have increased steadily. During November, 33 new ESG ETFs/ETPs were launched.
Substantial inflows can be attributed to the top 20 ETFs/ETPs by net new assets, which collectively gathered $6.85 Bn in November. iShares Trust iShares ESG Aware MSCI USA ETF (ESGU US) gathered $807 Mn the largest individual net inflow.
Top 20 ESG ETFs/ETPs by net new assets November 2021
|
Name |
Ticker |
Assets (US$ Mn) Nov-21 |
NNA (US$ Mn) YTD-21 |
NNA (US$ Mn) Nov-21 |
|
iShares Trust iShares ESG Aware MSCI USA ETF |
ESGU US |
24,123.28 |
7,469.83 |
806.52 |
|
Mirae Asset TIGER China Electric Vehicle Solactive ETF |
371460 KS |
2,565.36 |
1,925.49 |
635.58 |
|
AMUNDI INDEX MSCI EUROPE SRI - UCITS ETF DR (C) - Acc |
EUSRI FP |
2,912.45 |
1,038.39 |
503.77 |
|
iShares MSCI USA ESG Select ETF |
SUSA US |
4,497.90 |
1,541.41 |
466.44 |
|
UBS Irl ETF Plc - MSCI ACWI ESG Universal Low Carbon Select UCITS ETF |
AWESG SW |
481.16 |
491.62 |
442.40 |
|
Lyxor Net Zero 2050 S&P Eurozone Climate PAB (DR) UCITS ETF - Acc |
EPAB FP |
1,519.44 |
1,147.16 |
434.05 |
|
UBS Lux Fund Solutions - Sustainable Development Bank Bonds UCITS ETF - Acc - Acc |
MDBA GY |
734.16 |
531.75 |
337.75 |
|
Invesco Nasdaq-100 ESG UCITS ETF - Acc |
NESP LN |
6.76 |
645.31 |
334.99 |
|
CSIF IE MSCI USA Small Cap ESG Leaders Blue UCITS ETF - Acc |
USSMC SW |
609.96 |
424.31 |
333.47 |
|
iShares ESG MSCI EAFE ETF |
ESGD US |
7,064.30 |
2,950.45 |
316.48 |
|
iShares MSCI USA SRI UCITS ETF - Acc |
SUAS LN |
8,289.41 |
1,979.36 |
285.09 |
|
iShares MSCI EM SRI UCITS ETF - Acc |
SUES LN |
3,075.89 |
1,491.27 |
258.14 |
|
Huatai-PineBridge CSI Photovoltaic Industry ETF |
515790 CH |
2,429.88 |
333.90 |
234.95 |
|
Amundi MSCI Emerging Ex China Esg Leaders Select UCITS ETF Dr - Acc |
EMXG LN |
219.73 |
231.27 |
231.27 |
|
CTBC TIP Customized Taiwan Green Energy and Electric Vehicles ETF |
00896 TT |
209.81 |
223.09 |
213.06 |
|
iShares MSCI World SRI UCITS ETF - EUR - Acc |
SUSW LN |
4,662.71 |
1,614.24 |
210.55 |
|
UBS Lux Fund Solutions - MSCI Japan Socially Responsible UCITS ETF (JPY) A-dis |
FRCJ GY |
816.33 |
283.77 |
208.28 |
|
Vanguard ESG International Stock ETF |
VSGX US |
2,956.93 |
1,362.88 |
205.56 |
|
UBS Lux Fund Solutions - MSCI Emerging Markets Socially Responsible UCITS ETF (USD) A-dis |
MSRUSA SW |
1,311.04 |
627.53 |
201.25 |
|
Vanguard ESG US Stock ETF |
ESGV US |
6,022.49 |
2,112.08 |
186.90 |
Confusion persists around what constitutes an ESG fund. According to PRI, a UN-supported initiative which seeks to understand the investment implications of ESG issues, 56% of adopters believe there is a lack of clarity in ESG definitions. ETFGI’s classification system attempts to provide greater precision, with ETFs/ETPs listed globally organised into categories, including core ESG products and theme-based groups, such as Clean/Alternative Energies and Gender Diversity.


