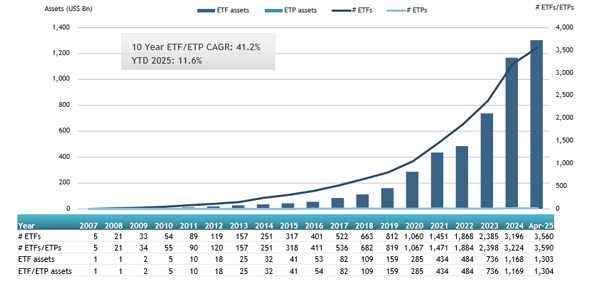
ETFGI, a leading independent research and consultancy firm renowned for its expertise in subscription research, consulting services, events, and ETF TV on trends in the global ETF industry, reported today that assets invested in actively managed exchange-traded funds (ETFs) worldwide surged to a new all-time high of $1.30 trillion at the end of April.
According to ETFGI’s April 2025 Active ETF and ETP Industry Landscape Insights Report, a subscription-based research service, actively managed ETFs listed globally attracted $32.20 billion in net inflows during April alone. This brings year-to-date net inflows to a record $176.75 billion, highlighting sustained investor interest in active strategies amid shifting market dynamics.
- Assets invested in actively managed ETFs listed globally climbed to a record $1.30 trillion at the end of April 2025, surpassing the previous high of $1.27 trillion recorded just a month earlier in March.
- Net inflows of $32.20 Bn in April 2025.
- Year-to-date (YTD) net inflows into actively managed ETFs reached an unprecedented $176.75 billion at the end of April 2025 — the highest on record. This surpasses the previous YTD records of $96.93 billion in 2024 and $61.41 billion in 2021, reflecting a sharp acceleration in investor demand for active strategies
- 61st month of consecutive net inflows.
The S&P 500 Index declined by 0.68% in April and is down 4.92% year-to-date (YTD) in 2025. In contrast, the Developed Markets Ex-U.S. Index rose 4.86% in April and is up 10.85% YTD. Among developed markets, Spain and Portugal posted the strongest gains in April, rising 8.65% and 7.67%, respectively. The Emerging Markets Index increased by 0.88% during April and is up 1.80% YTD. Within emerging markets, Hungary led with a 10.78% gain, followed closely by Mexico at 10.40%," said Deborah Fuhr, Managing Partner, Founder, and Owner of ETFGI.
Growth in assets in actively managed ETFs listed globally at of end of April

There were 3,590 actively managed ETFs listed globally, with 4,616 listings, assets of $1.30 Tn, from 558 providers listed on 41 exchanges in 32 countries at the end of April.
Actively managed ETFs listed globally attracted $32.20 billion in net inflows during April 2025, according to ETFGI.
Equity-focused actively managed ETFs led the way, pulling in $22.49 billion for the month. This brought year-to-date equity inflows to $96.18 billion, significantly outpacing the $58.16 billion recorded over the same period in 2024.
Fixed income-focused actively managed ETFs also saw robust demand, with $7.33 billion in net inflows during April. Year-to-date inflows for fixed income products reached $65.04 billion, doubling the $32.78 billion reported through April 2024.
A significant portion of April’s net inflows into actively managed ETFs can be attributed to the top 20 products by net new assets, which collectively brought in $13.41 billion during the month.
Leading the pack was the JPMorgan Nasdaq Equity Premium Income ETF (JEPQ US), which recorded the largest individual net inflow of $1.67 billion, highlighting strong investor demand for income-generating equity strategies
Top 20 actively managed ETFs by net new assets April 2025
|
Name |
Ticker |
Assets |
NNA |
NNA |
|
JPMorgan Nasdaq Equity Premium Income ETF |
JEPQ US |
24,342.12 |
5,634.15 |
1,672.29 |
|
Hwabao WP Cash Tianyi Listed Money Market Fund |
511990 CH |
10,834.76 |
(199.50) |
1,620.31 |
|
Yinhua Traded Money Market Fund |
511880 CH |
10,253.49 |
1,827.25 |
1,359.44 |
|
Dimensional International Value ETF |
DFIV US |
10,788.78 |
1,600.18 |
970.32 |
|
Capital Group Dividend Value ETF |
CGDV US |
15,055.98 |
3,002.10 |
845.13 |
|
Avantis US Large Cap Value ETF |
AVLV US |
6,722.09 |
2,002.87 |
799.15 |
|
Capital Group Growth ETF |
CGGR US |
10,773.62 |
2,217.05 |
624.20 |
|
JPMorgan Equity Premium Income ETF |
JEPI US |
38,937.25 |
3,321.44 |
533.83 |
|
SAMSUNG KODEX Money Market Active ETF |
488770 KS |
4,302.98 |
1,552.42 |
518.08 |
|
PIMCO Multi Sector Bond Active ETF |
PYLD US |
4,939.09 |
2,196.02 |
509.52 |
|
T Rowe Price QM US Bond ETF |
TAGG US |
1,286.35 |
1,175.75 |
499.78 |
|
YieldMax MSTR Option Income Strategy ETF |
MSTY US |
3,270.95 |
1,831.48 |
488.94 |
|
Direxion Daily TSLA Bull 2X Shares |
TSLL US |
5,092.73 |
3,901.26 |
459.93 |
|
CIBC Qx US Low Volatility Dividend ETF |
CQLU CN |
611.26 |
608.25 |
426.92 |
|
ICBC CICC USD Money Market ETF |
9011 HK |
1,211.78 |
448.59 |
392.86 |
|
BMO Money Market Fund |
ZMMK CN |
3,440.86 |
1,081.24 |
348.04 |
|
iShares U.S. Equity Factor Rotation Active ETF |
DYNF US |
15,477.45 |
2,669.13 |
340.72 |
|
Sterling Capital Enhanced Core Bond ETF |
SCEC US |
351.05 |
346.80 |
338.06 |
|
iShares Ultra Short-Term Bond Active ETF |
ICSH US |
5,993.61 |
659.64 |
331.00 |
|
JPMorgan ETFs (Ireland) ICAV - Global Research Enhanced Index Equity (ESG) UCITS ETF |
JREG LN |
9,166.47 |
806.04 |
329.14 |

Investors have tended to invest in actively managed ETFs providing exposure to equities during April.


