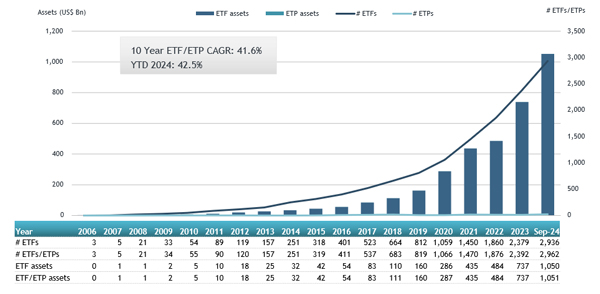
ETFGI, a prominent independent research and consultancy firm specializing in providing subscription research and events on trends in the global ETFs industry, reported today that assets invested in actively managed ETFs listed globally reached a new record of US$1.05 trillion at the end of September. Actively managed ETFs gathered net inflows of US$26.85 billion during September, bringing year-to-date net inflows to a record US$240.14 billion, according to ETFGI's September 2024 Active ETF and ETP industry landscape insights report, an annual paid-for research subscription service. (All dollar values in USD unless otherwise noted.)
In the United States where actively managed ETFs are able to use semi or non-transparent models we see that only 52 of the 1,659 actively managed ETFs use a semi or non-transparent model and account for only $14 billion of the $791 billion in these strategies.
- Assets invested in actively managed ETFs listed globally reached a new record of $1.05 Tn at the end of September beating the previous record of $1.01 Tn at the end of August 2024.
- Assets invested have increased 42.5% year-to-date in 2024, going from $737.06 Bn at the end of 2023 to $1.05 Tn.
- Net inflows of $26.85 Bn during September 2024.
- Year-to-date net inflows of $240.14 Bn are the highest on record, followed by year-to-date net inflows of $113.80 Bn in 2023, and the third highest record was year to date net inflows of $106.90 Bn in 2021.
- 54th month of consecutive net inflows.
“The S&P 500 index increased by 2.14% in September and is up by 22.08% year-to-date in 2024. The developed market index excluding the US increased by 1.26% in September and is up 12.53% YTD in 2024. Hong Kong (up 16.51%) and Singapore (up 7.43%) saw the largest increases amongst the developed markets in September. The emerging market index increased by 7.72% during September and is up 19.45% YTD in 2024. China (up 23.89%) and Thailand (up 12.43%) saw the largest increases amongst emerging markets in September.” According to Deborah Fuhr, managing partner, founder, and owner of ETFGI.
Global growth in assets invested in Actively managed ETFs at end of September

At the end of September 2024, the Global active ETF/ETP industry had 2,962 ETFs/ETPs, with 3,679 listings, assets of $1.05 Tn, from 485 providers on 37 exchanges in 29 countries.
Equity focused actively managed ETFs listed globally gathered net inflows of $15.49 Bn during September, bringing year to date net inflows to $139.00 Bn, higher than the $76.15 Bn in net inflows YTD in 2023. Fixed Income focused actively managed ETFs listed globally attracted net inflows of $10.19 Bn during September, bringing YTD net inflows to $86.36 Bn, much higher than the $36.20 Bn in net inflows YTD in 2023.
Substantial inflows can be attributed to the top 20 active ETFs by net new assets, which collectively gathered
$12.75 Bn during September. Blackrock Flexible Income ETF (BINC US) gathered $1.58 Bn, the largest individual net inflow.
Top 20 actively managed ETFs/ETPs by net new assets September 2024
|
Name |
Ticker |
Assets |
NNA |
NNA |
|
Blackrock Flexible Income ETF |
BINC US |
5,692.48 |
5,102.51 |
1,584.14 |
|
JPMorgan Global Select Equity ETF |
JGLO US |
4,715.14 |
3,263.79 |
967.05 |
|
JPMorgan Ultra-Short Income ETF |
JPST US |
26,192.80 |
3,583.09 |
781.83 |
|
Blackrock US Equity Factor Rotation ETF |
DYNF US |
12,031.71 |
10,584.24 |
780.77 |
|
Fidelity Total Bond ETF |
FBND US |
12,468.44 |
5,501.32 |
763.47 |
|
SAMSUNG KODEX Money Market Active ETF |
488770 KS |
1,327.87 |
1,316.21 |
701.31 |
|
Vanguard Core Bond ETF |
VCRB US |
1,161.49 |
1,101.53 |
653.62 |
|
Janus Henderson AAA CLO ETF |
JAAA US |
12,562.70 |
7,132.00 |
649.10 |
|
JPMorgan Nasdaq Equity Premium Income ETF |
JEPQ US |
16,917.65 |
7,362.79 |
625.44 |
|
Capital Group Dividend Value ETF |
CGDV US |
11,235.24 |
4,085.54 |
589.78 |
|
Dimensional US Equity ETF |
DFUS US |
11,030.32 |
1,606.34 |
587.53 |
|
Avantis U.S. Small Cap Value ETF |
AVUV US |
13,773.37 |
3,901.49 |
568.89 |
|
JPMorgan Equity Premium Income ETF |
JEPI US |
36,076.74 |
2,913.77 |
520.56 |
|
Avantis Emerging Markets Equity ETF |
AVEM US |
7,127.97 |
1,648.62 |
494.78 |
|
Lyxor Smart Overnight Return - UCITS ETF - C-EUR |
CSH2 FP |
4,129.81 |
1,253.79 |
487.56 |
|
Fidelity Sustainable USD Corporate Bond Paris-Aligned Multifactor UCITS ETF |
FUIE GY |
499.32 |
466.57 |
466.57 |
|
Fidelity Investment Grade Securitized ETF |
FSEC US |
555.43 |
553.19 |
465.65 |
|
Dimensional US Core Equity 2 ETF |
DFAC US |
31,250.20 |
2,596.70 |
359.03 |
|
JPMorgan ETFs (Ireland) ICAV - Global Research Enhanced Index Equity (ESG) UCITS ETF |
JREG LN |
7,377.40 |
2,535.85 |
352.71 |
|
JPMorgan Core Plus Bond ETF |
JCPB US |
4,246.75 |
1,748.90 |
351.43 |

Investors have tended to invest in Equity actively managed ETFs during September.


