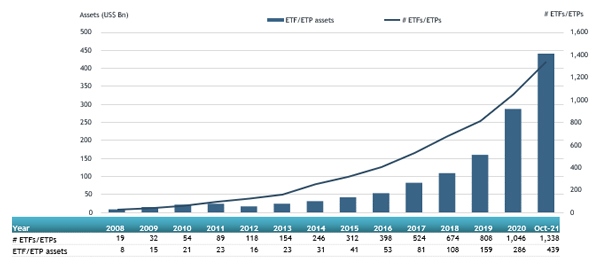
ETFGI, a leading independent research and consultancy firm covering trends in the global ETF/ETP ecosystem, reported today that actively managed ETFs and ETPs gathered net inflows of US$10.36 billion during October, bringing year-to-date net inflows to US$120.28 billion. Assets invested in actively managed ETFs/ETPs finished the month up to 5.1%, from US$418 billion at the end of September to US$439 billion, according to ETFGI's October 2021 Active ETF and ETP industry landscape insights report, the monthly report which is part of an annual paid-for research subscription service. (All dollar values in USD unless otherwise noted.)
- Record $439 Bn invested in actively managed ETFs and ETPs industry at end of October 2021.
- Assets increased 53.6% YTD in 2021 going from $285.83 Bn at end of 2020 to $438.94 Bn.
- Record YTD 2021 net inflows of $120.28 Bn beating prior record of $58.56 Bn gathered in YTD 2020.
- $120.28 Bn YTD net inflows are $29.18 Bn greater than the full year 2020 record net inflows $91.10 Bn.
- $152.83 Bn in net inflows gathered in the past 12 months.
- 19th month of consecutive net inflows
- Actively managed Equity ETFs and ETPs gathered a record $57.93 Bn in YTD net inflows 2021.
“Due to strong corporate earnings the S&P 500 gained 7.01% in October and is up 24.04% year to date. Developed markets ex-U.S. experienced gains of 2.50% in October. Canada 7.46% and Sweden 7.21% were the leaders of the month while Japan suffer the biggest loss of 3.43%. Emerging markets were up by 1.00% during October. Peru (up 14.45%) and Egypt (up 10.76%) were the leaders, whilst Brazil (down 10.72%) and Chile (down 5.66%) were down the most.” According to Deborah Fuhr, managing partner, founder and owner of ETFGI.
Growth in actively managed ETF and ETP assets as of the end of October 2021

At the end of October 2021, the Global Active ETF/ETP industry had 1,338 ETFs/ETPs, with 1,646 listings, assets of $439 Bn, from 258 providers listed on 29 exchanges in 22 countries.
Equity focused actively managed ETFs/ETPs listed globally gathered net inflows of $5.21 Bn during October, bringing net inflows YTD 2021 to $57.93 Bn, more than the $19.47 Bn in net inflows equity products had attracted for the YTD in 2020. Fixed Income focused actively managed ETFs/ETPs listed globally attracted net inflows of $2.53 Bn during October, bringing net inflows YTD 2021 to $48.33 Bn, much greater than the $34.72 Bn in net inflows fixed income products had attracted YTD in 2020.
Substantial inflows can be attributed to the top 20 active ETFs/ETPs by net new assets, which collectively gathered $6.73 Bn during October. Nuveen Growth Opportunities ETF (NUGO US) gathered $1.65 Bn the largest individual net inflow.
Top 20 actively managed ETFs/ETPs by net new assets October 2021
|
Name |
Ticker |
Assets |
NNA |
NNA |
|
Nuveen Growth Opportunities ETF |
NUGO US |
1,687.38 |
1,650.03 |
1,645.20 |
|
ProShares Bitcoin Strategy ETF |
BITO US |
1,200.91 |
1,242.98 |
1,242.98 |
|
JPMorgan Equity Premium Income ETF |
JEPI US |
4,537.30 |
4,216.98 |
561.10 |
|
Invesco Optimum Yield Diversified Commodity Strategy No K-1 ETF |
PDBC US |
6,885.73 |
2,409.55 |
549.08 |
|
Hwabao WP Cash Tianyi Listed Money Market Fund |
511990 CH |
28,190.56 |
9,987.31 |
464.88 |
|
Quadratic Interest Rate Volatility and Inflation ETF |
IVOL US |
3,614.11 |
2,767.82 |
296.14 |
|
SPDR Blackstone/GSO Senior Loan ETF |
SRLN US |
7,976.07 |
5,726.92 |
261.76 |
|
Avantis U.S. Small Cap Value ETF |
AVUV US |
1,946.80 |
1,106.95 |
250.19 |
|
First Trust Senior Loan ETF |
FTSL US |
2,865.60 |
1,540.53 |
169.79 |
|
Dimensional US Core Equity 2 ETF |
DFAC US |
14,458.10 |
526.36 |
150.62 |
|
Horizon Kinetics Inflation Beneficiaries ETF |
INFL US |
887.13 |
824.64 |
148.77 |
|
First Trust Global Tactical Commodity Strategy Fund |
FTGC US |
2,094.73 |
1,593.31 |
141.97 |
|
Victoryshares ESG Core Plus Bond ETF |
UBND US |
125.25 |
125.44 |
125.44 |
|
Manulife Smart Short-Term Bond ETF |
TERM CN |
564.20 |
566.25 |
111.41 |
|
Dimensional International Core Equity Market ETF |
DFAI US |
767.45 |
632.80 |
105.94 |
|
Dimensional US Targeted Value ETF |
DFAT US |
6,449.33 |
343.98 |
104.91 |
|
Vanguard Ultra Short-Term Bond ETF |
VUSB US |
1,848.24 |
1,850.18 |
102.60 |
|
Victoryshares ESG Corporate Bond ETF |
UCRD US |
100.97 |
101.08 |
101.08 |
|
First Trust Preferred Securities and Income Fund |
FPE US |
7,697.90 |
1,723.95 |
99.24 |
|
WisdomTree US Efficient Core Fund |
NTSX US |
796.53 |
301.37 |
93.20 |

Investors have tended to invest in Equity actively managed ETFs/ETPs during October.


