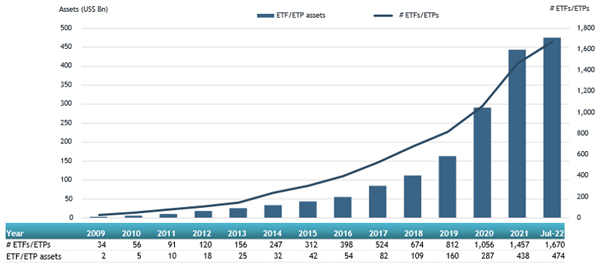
ETFGI, a leading independent research and consultancy firm covering trends in the global ETFs ecosystem, reported today that assets invested in Active ETFs listed globally reach record US$474 billion at the end of July. Active ETFs listed globally gathered US$8.22 billion US dollars of net inflows during July 2022, bringing year-to-date net inflows to US$71.41 billion. Assets invested in actively managed ETFs increased by 5.3%, going from US$450 billion at the end of June 2022 to US$474 billion, according to ETFGI's July 2022 Active ETF and ETP industry landscape insights report, an annual paid-for research subscription service. (All dollar values in USD unless otherwise noted.)
- Assets invested in actively managed ETFs listed globally reached a record $474 Bn at end of July 2022
- Assets have increased 7.1% year-to-date in 2022, going from $442 Bn at the end of 2021 to $474 Bn.
- Net inflows of $8.22 Bn during July.
- YTD net inflows of $71.41 Bn are the 2nd highest on record, after the YTD net inflows in 2021 of $88.97 Bn.
- 28th month of consecutive net inflows.
- Actively managed Equity ETFs and ETPs gathered $5.71 Bn in net inflows in July.
“The S&P 500 increased by 9.22% in July but is down 12.58% YTD 2022. Developed markets excluding the US increased by 5.32% in July but are down 15.84% YTD 2022. Sweden (up 12.13%) and Netherlands (up 9.64%) saw the largest increases amongst the developed markets in July. Emerging markets decreased by 0.40% during July and are down 16.46% YTD in 2022. Pakistan (down 16.59%) and China (down 8.77%) saw the largest decreases amongst emerging markets in July, while Chile (up 12.24%) and India (up 9.14%) saw the largest increases.” According to Deborah Fuhr, managing partner, founder and owner of ETFGI.
Growth in actively managed ETF and ETP assets as of the end of July 2022

At the end of July there were 1,670 Active ETFs listed globally, with 2,137 listings, assets of $474 Bn, from 319 providers listed on 30 exchanges in 23 countries.
Active ETFs providing equity exposure listed globally gathered net inflows of $5.71 Bn during July, bringing year to date net inflows to $47.52 Bn, higher than the $40.84 Bn in net inflows active equity products had attracted at this point in 2021. Fixed Income focused active ETFs listed globally attracted net inflows of $2.27 Bn during July, bringing net inflows for the year through July 2022 to $13.06 Bn, lower than the $37.62 Bn in net inflows fixed income products had reported in the seven months of 2021.
Substantial inflows can be attributed to the top 20 active ETFs/ETPs by net new assets, which collectively gathered
$7.13 Bn during July. Hwabao WP Cash Tianyi Listed Money Market Fund (511990 CH) gathered $1.75 Bn, the largest individual net inflow.
Top 20 actively managed ETFs/ETPs by net new assets July 2022
|
Name |
Ticker |
Assets |
NNA |
NNA |
|
Hwabao WP Cash Tianyi Listed Money Market Fund |
511990 CH |
22,566.65 |
933.96 |
1,751.58 |
|
JPMorgan Equity Premium Income ETF |
JEPI US |
11,690.54 |
6,510.80 |
1,127.84 |
|
First Trust Enhanced Short Maturity Fund |
FTSM US |
5,639.47 |
1,416.91 |
451.41 |
|
JPMorgan Ultra-Short Income ETF |
JPST US |
20,373.97 |
2,051.52 |
447.98 |
|
ARK Innovation ETF |
ARKK US |
9,334.31 |
1,912.52 |
443.12 |
|
TD Canadian Long Term Federal Bond ETF |
TCLB CN |
1,052.21 |
875.41 |
313.28 |
|
JPMorgan US Research Enhanced Index Equity ESG UCITS ETF - Acc |
JREU LN |
1,471.46 |
603.73 |
300.46 |
|
Innovator U.S. Equity Power Buffer ETF - July |
PJUL US |
449.08 |
236.44 |
261.02 |
|
CI High Interest Savings ETF |
CSAV CN |
2,268.87 |
637.56 |
236.91 |
|
Dimensional US Core Equity 2 ETF |
DFAC US |
15,120.42 |
1,821.99 |
232.31 |
|
Samsung KODEX KOFR Active ETF (Synth) |
423160 KS |
1,133.01 |
1,153.12 |
192.75 |
|
Dimensional International Core Equity Market ETF |
DFAI US |
1,822.02 |
969.53 |
177.72 |
|
Dimensional International Core Equity 2 ETF |
DFIC US |
737.96 |
745.49 |
162.12 |
|
Andishe Varzan ETF - Acc |
AVSF1 |
837.63 |
170.31 |
154.26 |
|
High Interest Savings Account Fund |
HISA CN |
349.43 |
142.84 |
151.44 |
|
PIMCO Euro Short Maturity Source UCITS ETF - Acc |
PJSR GY |
1,409.74 |
173.74 |
150.41 |
|
PIMCO US Dollar Short Maturity ETF |
MINT LN |
2,748.32 |
(1,576.97) |
150.09 |
|
Purpose High Interest Savings ETF |
PSA CN |
1,721.67 |
299.30 |
147.36 |
|
Dimensional Emerging Markets Core Equity 2 ETF |
DFEM US |
499.03 |
514.36 |
140.42 |
|
Pingan-Uob Traded Money Market Fund - Acc |
511700 CH |
231.13 |
201.03 |
135.34 |
Investors have tended to invest in Equity actively managed ETFs/ETPs during July.


.jpg)


