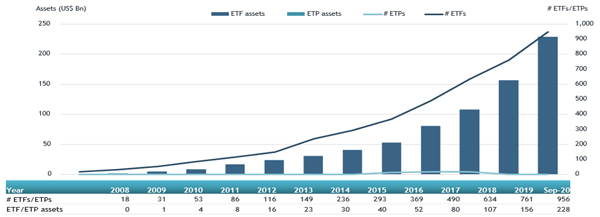
ETFGI, a leading independent research and consultancy firm covering trends in the global ETF and ETP ecosystem, reported today that active ETFs and ETPs gathered net inflows of US$8.24 billion during September, bringing year-to-date net inflows to a record US$51.48 billion which is significantly more than the US$29.41 billion gathered through Q3 2019 as well as the US$42.10 billion gathered in all of 2019. Assets invested in Active ETFs and ETPs increased 10.5% during September, reaching a new record of US$228.41 billion, according to ETFGI's September 2020 Active ETF and ETP industry landscape insights report, an annual paid-for research subscription service. (All dollar values in USD unless otherwise noted.)
Highlights
- Assets invested in Active ETFs and ETPs reached a new record high of $228.41 billion at the end of Q3
- YTD net inflows are at a record $51.48 billion which is significantly more than the $29.41 billion gathered through Q3 2019 as well as the US$42.10 billion gathered in all of 2019
“The S&P 500 declined 3.8% in September, with concerns over back-to-school (and resulting COVID cases), U.S. elections and stimulus talks. Strong prior month gains boosted the index higher to close up 8.9% for Q3. Global equities declined 3.1% in September, as measured by the S&P Global BMI. Despite the monthly decline, the global benchmark managed to finish Q3 up 8.1% Q3 and up 0.7% YTD. Emerging markets, declined 2.2% in September but closed up 9.0% for Q3.” According to Deborah Fuhr, managing partner, founder and owner of ETFGI.
At the end of Q3, the Global active ETF/ETP industry had 956 ETFs/ETPs, with 1,199 listings, assets of $228 Bn, from 181 providers listed on 25 exchanges in 18 countries.
Growth in actively managed ETF and ETP assets as of the end of September 2020

In September, Active ETFs and ETPs gathered net inflows of $8.24 Bn. YTD through end of Q3, ETFs/ETPs saw net inflows of $51.47 Bn. Fixed Income focused Active ETFs/ETPs listed globally gathered net inflows of $5.25 billion during September, bringing net inflows through Q3 to $30.81 billion, more than the $22.74 billion in net inflows Fixed Income products had attracted through Q3 2019. Equity focused Active ETFs/ETPs listed globally attracted net inflows of $1.73 billion during September, bringing net inflows for the year through Q3 2020 to $16.39 billion, greater than the $5.89 billion in net inflows equity products had attracted for the year to Q3 2019.
Substantial inflows can be attributed to the top 20 ETFs/ETPs by net new assets, which collectively gathered $6.83 billion during September. Hwabao WP Cash Tianyi Listed Money Market Fund (511990 CH) gathered $2.27 billion alone.
Top 20 actively managed ETFs/ETPs by net new assets September 2020
|
Name |
Ticker |
Assets |
NNA |
NNA |
|
Hwabao WP Cash Tianyi Listed Money Market Fund |
511990 CH |
18,193.60 |
2,272.86 |
2,272.86 |
|
JPMorgan Ultra-Short Income ETF |
JPST US |
14,599.47 |
4,310.91 |
710.83 |
|
ARK Innovation ETF |
ARKK US |
8,871.34 |
4,208.00 |
674.31 |
|
Cabana Target Drawdown 10 ETF |
TDSC US |
473.59 |
476.65 |
476.65 |
|
iShares Liquidity Income ETF |
ICSH US |
4,713.79 |
2,069.44 |
338.70 |
|
First Trust TCW Opportunistic Fixed Income ETF |
FIXD US |
3,950.56 |
2,569.31 |
317.16 |
|
Cabana Target Drawdown 7 ETF |
TDSB US |
310.81 |
312.65 |
312.65 |
|
First Trust Low Duration Mortgage Opportunities ETF |
LMBS US |
6,158.46 |
2,190.63 |
286.67 |
|
Janus Short Duration Income ETF |
VNLA US |
2,442.56 |
1,296.57 |
209.06 |
|
Cabana Target Drawdown 13 ETF |
TDSD US |
162.43 |
162.94 |
162.94 |
|
Innovator S&P 500 Power Buffer ETF |
PSEP US |
221.77 |
201.98 |
159.81 |
|
ARK Genomic Revolution Multi-Sector ETF |
ARKG US |
2,308.55 |
1,119.33 |
134.22 |
|
Invesco Ultra Short Duration ETF |
GSY US |
2,980.92 |
166.64 |
116.24 |
|
JPMorgan Ultra-Short Municipal Income ETF |
JMST US |
693.40 |
544.15 |
109.59 |
|
USAA Core Short-Term Bond ETF |
USTB US |
214.58 |
118.62 |
108.57 |
|
ARK Fintech Innovation ETF |
ARKF US |
674.06 |
479.89 |
103.15 |
|
PIMCO Total Return Active Exchange-Traded Fund |
BOND US |
3,724.38 |
696.56 |
101.22 |
|
Cambria Tail Risk ETF |
TAIL US |
407.21 |
331.12 |
80.49 |
|
Quadratic Interest Rate Volatility and Inflation ETF |
IVOL US |
570.15 |
474.22 |
76.62 |
|
Cabana Target Drawdown 16 ETF |
TDSE US |
75.52 |
75.72 |
75.72 |

Investors have tended to invest in Fixed Income actively managed ETFs/ETPs during September.


