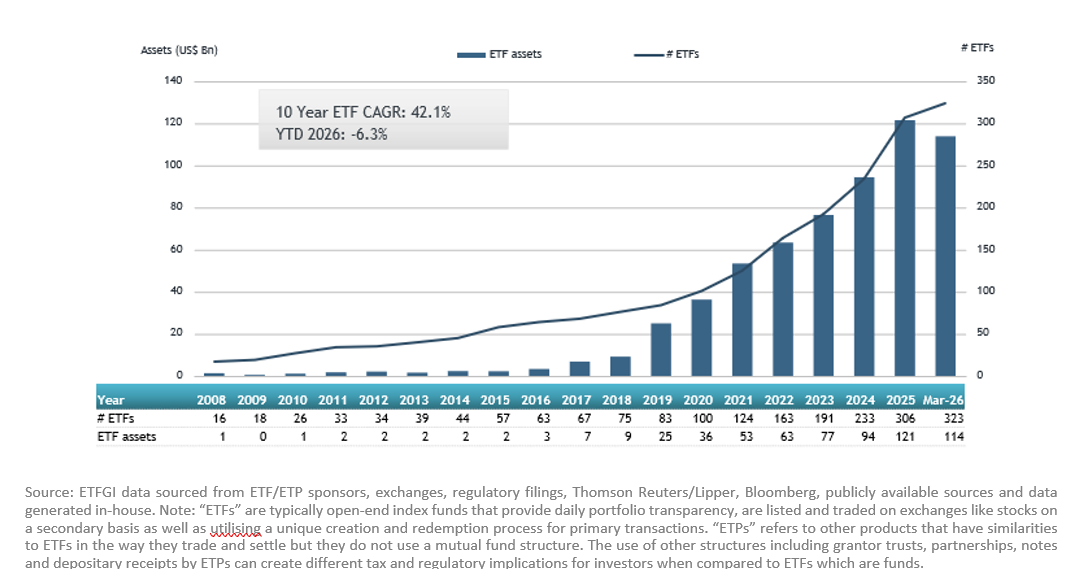
ETFGI, reports the latest industry data from India highlights a clear divergence in growth profiles, investor composition, and usage between Gold ETFs and non‑gold ETFs, underscoring their distinct but complementary roles within portfolios. In March 2026, nearly 42.2% of the assets invested in gold ETFs were held by high-net-worth and retail investors, source from Association of Mutual Funds in India. ETFGI, is a 14 year old leading independent research and consultancy firm renowned for its expertise in subscription research, consulting services, 6 annual ETFGI Global ETFs Insights Summits, and ETF TV on global ETF industry trends. (All dollar values in USD unless otherwise noted.)
Assets invested in Gold ETFs have demonstrated exceptional growth momentum, increasing from approximately $2.5 billion in March 2022 to $18.3 billion in March 2026—representing more than a 7 fold expansion over four years.
Investor participation has expanded significantly, with the number of accounts rising to over 12.4 million in 2026, compared to ~4.2 million in 2022, reflecting strong acceleration in adoption.
Highlights
- Retail investors dominate flows and ownership, accounting for ~95% of folios in 2026, broadly consistent over time.
- Corporates remain significant in terms of AUM (~58% of assets) but represent a small number of accounts, reinforcing the concentration of institutional allocation.
- High‑net‑worth participation has grown steadily, representing ~31% of assets, indicating increasing use in sophisticated portfolio construction.
Gold ETFs are increasingly being used as:
- A tactical hedge against macro uncertainty
- A portfolio diversifier amid equity market volatility
- A liquid alternative to physical gold exposure
The rapid growth in both assets and investor base suggests that Gold ETFs are evolving from niche allocation tools to mainstream portfolio components, particularly among retail investors.
Corporates dominate the investment in non-Gold ETFs in India
ETFs in India excluding gold ETFs have reached substantially larger scale, with assets rising from approximately $54 billion in March 2022 to $95.7 billion in March 2026, nearly doubling over the period.
However, growth has been more measured and structurally stable compared to Gold ETFs, reflecting their role as core portfolio building blocks rather than tactical allocations.
Highlights
- Corporates dominate AUM, representing ~83% of total assets, reinforcing the institutional nature of allocation.
- Retail investors account for the vast majority of accounts (~92%), highlighting broad accessibility and retail adoption.
- Total number of investor accounts increased significantly to ~27.9 million, indicating continued democratization of market access.
Non‑gold ETFs serve as:
- Core allocation vehicles across equity, fixed income, and diversified strategies
- Efficient tools for beta exposure, asset allocation, and portfolio construction
- Central components in both institutional and retail portfolios
The strong institutional asset share reflects long-term capital deployment, while the large and growing retail base signals continued structural demand for low-cost, transparent investment solutions.
Profile of investors in Gold ETFs in India – March 2026
| Gold ETFs | Investor Classification |
Assets (US$ Mn) |
% to Total |
No of Folios |
% to Total |
| Corporates |
10,600 |
57.79 |
72,846 |
0.59 |
|
| Banks/FIs |
0 |
0.00 |
5 |
0.00 |
|
| FIIs |
0 |
0.00 |
0 |
0.00 |
|
| High Networth Individuals* |
5,718 |
31.17 |
570,766 |
4.60 |
|
| Retail |
2,025 |
11.04 |
11,754,114 |
94.81 |
|
| Total |
18,342 |
100 |
12,397,731 |
100 |
*Defined as individuals investing Rs 2 lakhs and above
Source: Association of Mutual Funds in India
Profile of non-Gold ETFs in India – March 2026
| ETFs(other than Gold) | Investor Classification |
Assets (US$ Mn) |
% to Total |
No of Folios |
% to Total |
| Corporates |
79,079 |
82.63 |
211,617 |
0.76 |
|
| Banks/FIs |
182 |
0.19 |
51 |
0.00 |
|
| FIIs |
2 |
0.00 |
4 |
0.00 |
|
| High Networth Individuals* |
12,309 |
12.86 |
1,936,861 |
6.93 |
|
| Retail |
4,128 |
4.31 |
25,795,686 |
92.31 |
|
| Total |
95,700 |
100 |
27,944,219 |
100 |
*Defined as individuals investing Rs 2 lakhs and above
Source: Association of Mutual Funds in India
Assets of $114.04 Bn are the highest record for March 2026, while the second highest was of $98.04 Bn for 2025 and third highest record of $83.38 in 2024.
Consecutive 5 years March Indian ETFs investment comparison by investor classification – March 2026
| Investor Classification |
AUM ($ Mn) Mar-26 |
AUM ($ Mn) Mar-25 |
AUM ($ Mn) Mar-24 |
AUM ($ Mn) Mar-23 |
AUM ($ Mn) Mar-22 |
| Corporates |
89,678 |
85,378 |
73,951 |
54,842 |
51,196 |
| Banks/FIs |
182 |
539 |
153 |
186 |
203 |
| FIIs |
2 |
0 |
13 |
8 |
13 |
| High Networth Individuals* |
18,027 |
10,038 |
7,148 |
5,167 |
3,581 |
| Retail |
6,152 |
2,087 |
2,111 |
1,491 |
1,817 |
|
Total |
114,042 |
98,042 |
83,377 |
61,695 |
56,810 |
*Defined as individuals investing Rs 2 lakhs and above
source: Association of Mutual Funds in India
At the end of March 2026, the Indian ETF industry had 323 ETFs, with 323 listings, assets of $113.88 Bn, from 27 providers on 2 exchanges, source from ETFGI. During March, the ETFs industry in India gathered net inflows of $3.59 Bn. Equity ETFs gathered the largest net inflows with $3.28 Bn, followed by commodity ETFs with $686.53 Mn, while fixed income ETFs experienced net outflows with $376.56 Mn.
ETFs industry in India asset growth at end of March 2026