ETFGI, reported today Global Actively Managed ETFs Industry Reached a Record US$2.72 Trillion in Assets as Year-to-Date Net Inflows Hit All-Time High of US$663.6 Billion at the end of August. During August the actively managed ETFs industry globally gathered net inflows of US$73.12 billion, bringing year-to-date net inflows to a record US$663.59 billion, according to ETFGI's August 2026 Active ETF industry landscape insights report, an annual paid-for research subscription service. ETFGI, is a 14 year old leading independent research and consultancy firm renowned for its expertise in subscription research, consulting services, 6 annual ETFGI Global ETFs Insights Summits, and ETF TV on global ETF industry trends. (All dollar values in USD unless otherwise noted.)
Register to join us in New York City on Sept 29th for our 7thAnnual ETFGI Global ETFs Insights Summit - United States, to learn more about the trends with Active ETFs.
Highlights
- Assets invested in actively managed ETFs globally reached a record $2.72 trillion at the end of August 2026, surpassing the previous all-time high of $2.59 trillion recorded at the end of July 2026.
- Active ETF assets have increased 42.6% year-to-date, rising from $1.91 trillion at the end of 2025 to $2.72 trillion at the end of August 2026.
- The industry gathered net inflows of $73.12 billion in August 2026.
- Year-to-date net inflows reached a record $663.59 billion, exceeding the previous annual records of $375.98 billion in 2025 and $211.74 billion in 2024.
- August marked the 77th consecutive month of net inflows into actively managed ETFs globally, underscoring sustained investor demand.
“The S&P 500 declined slightly by 0.06% in July but remained up 10.14% year-to-date in 2026. Developed markets excluding the US gained 0.30% during July and were up 14.62% year-to-date, with Luxembourg (+12.10%) and Norway (+9.93%) posting the strongest gains among developed markets. Emerging markets fell 0.33% in July but remained up 9.40% year-to-date, while Taiwan (-7.80%) and Turkey (-5.91%) recorded the largest declines among emerging markets,” according to Deborah Fuhr, Managing Partner, Founder, and Owner of ETFGI.
Growth in assets in the actively managed ETFs industry as of end of August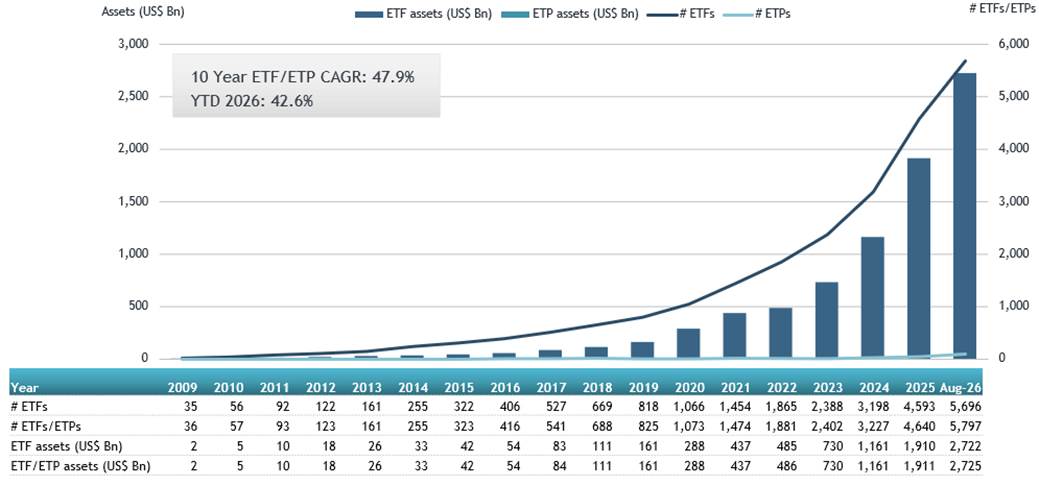
Source: ETFGI data sourced from ETF/ETP sponsors, exchanges, regulatory filings, Thomson Reuters/Lipper, Bloomberg, publicly available sources and data generated in-house. Note: “ETFs” are typically open-end index funds that provide daily portfolio transparency, are listed and traded on exchanges like stocks on a secondary basis as well as utilising a unique creation and redemption process for primary transactions. “ETPs” refers to other products that have similarities to ETFs in the way they trade and settle but they do not use a mutual fund structure. The use of other structures including grantor trusts, partnerships, notes and depositary receipts by ETPs can create different tax and regulatory implications for investors when compared to ETFs which are funds.
ETF providers
The actively managed ETF market remains concentrated among several leading providers. At the end of August, Dimensional led the segment with $320.1 billion in assets and an 11.8% market share, followed closely by JP Morgan with $319.1 billion and an 11.7% market share. iShares ranked third with $186.7 billion in assets and a 6.9% market share.
The three largest providers of actively managed ETFs, Dimensional, JP Morgan, and iShares, managed a combined $825.9 billion in assets at the end of August 2026, representing 30.4% of the industry's record $2.72 trillion in global assets. The three firms also gathered a combined $155.5 billion in net inflows year-to-date, accounting for 23.4% of the industry's record $663.6 billion in net new assets during 2026.
There were 5,797 Global actively managed ETFs with 7,950 listings, assets of $2.72 Tn, from 736 providers on 50 exchanges in 39 countries at the end of August 2026.
Net inflows
- Actively managed ETFs gathered net inflows of $73.12 billion in August 2026, extending the industry's streak to 77 consecutive months of positive net inflows.
- Year-to-date net inflows reached a record $663.59 billion, surpassing the previous annual records of $375.98 billion in 2025 and $211.74 billion in 2024.
- Equity-focused actively managed ETFs led asset gathering in August, attracting $42.47 billion in net inflows, representing approximately 58.1% of total industry net inflows during the month.
-
Year-to-date net inflows into equity-focused actively managed ETFs reached $398.25 billion, nearly double the $212.43 billion gathered during the same period in 2025.
- Fixed income-focused actively managed ETFs recorded net inflows of $29.73 billion in August, accounting for approximately 40.7% of total industry net inflows during the month.
- Year-to-date net inflows into fixed income-focused actively managed ETFs reached $208.49 billion, significantly higher than the $144.75 billion recorded through August 2025.
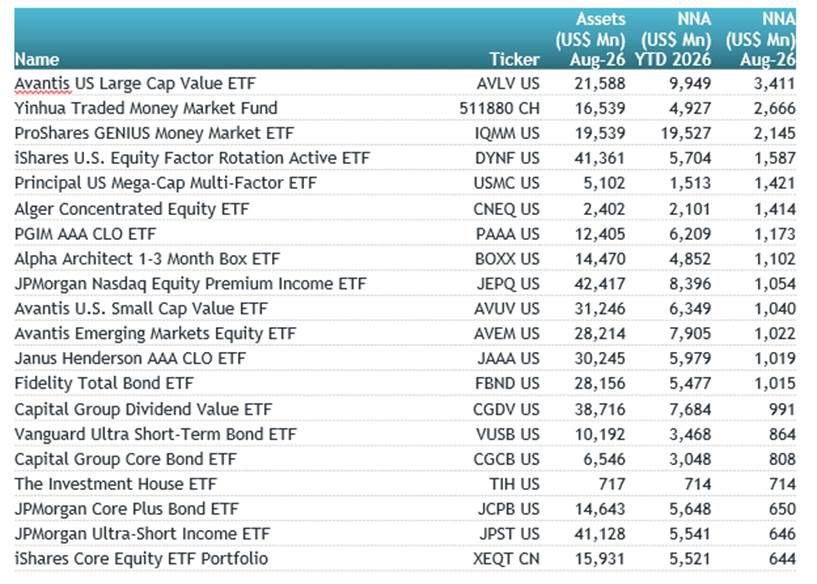
Substantial inflows can be attributed to the top 20 ETFs/ETPs by net new assets, which collectively gathered $25.39 Bn in August, the Avantis US Large Cap Value ETF (AVLV US) gathered $3.41 Bn alone.
Top 20 actively managed ETFs/ETPs by net new assets August 2026
Source: ETFGI data sourced from ETF/ETP sponsors, exchanges, regulatory filings, Thomson Reuters/Lipper, Bloomberg, publicly available sources and data generated in-house. Note: This report is based on the most recent data available at the time of publication. Asset and flow data may change slightly as additional data becomes available.
Investors have tended to invest in Equity actively managed ETFs during August.