In February, the price of Bitcoin and Ethereum rose by 1.5% and 5.7%, respectively (data up to 24th February), a trend reversal from a multi-month decline that has seen the majority of cryptocurrencies fall from their November highs.
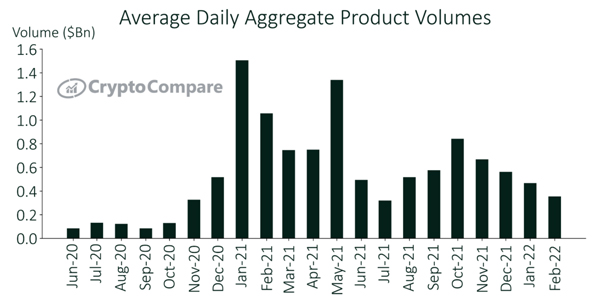
Although the price of both BTC and ETH rose over the last 30 days, trading volumes have fallen across the board - with average daily aggregate product trading volume currently standing at $353mn, down 24.2% from January.
Access CryptoCompare's latest Digital Asset Management Review for all the latest insights.
Key takeaways:
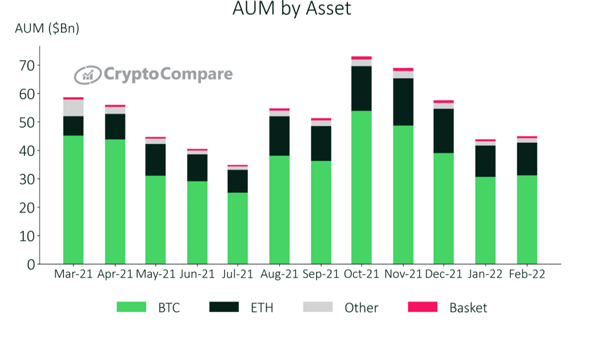
- Total assets under management rose for the first time in 4 months, increasing 2.3% to $44.9bn. However, this is still 39.8% below the all-time high that was reached in October.
- The increase in AUM was consistent across all product types, with exchange-traded certificates rising the most, up 17.0% month-on-month, to $3.6bn.
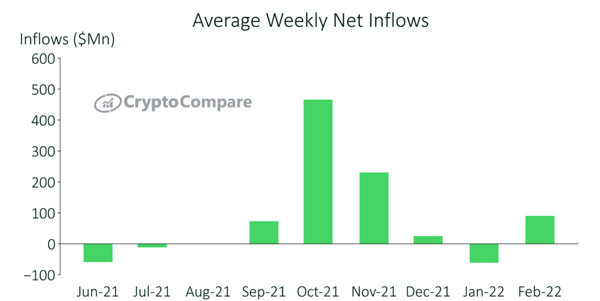
- Average weekly net inflows finally reversed their downward trend as they turned positive, averaging $89.9mn in February. Prior to this, weekly net inflows had been in constant decline since reaching an all-time high in October.
- The majority of the inflows can be attributed to Bitcoin products which contributed around 68% of the average weekly net inflows.
- Grayscale saw large drops in trading volume of their Bitcoin Trust product (down 20.3% to $153mn), and Ethereum Trust product (down 30.1% to $96.6mn).
Trading Volumes Fall Despite Increasing AUM & Price
Despite the price of BTC and ETH increasing 1.5% to $37,271 and 5.7% to $2,581, respectively, in the last 30 days, trading volumes have fallen across the board. Average daily aggregate product trading volume currently stands as $353mn, down 24.2% from January.

AUM Rebounds As BTC & ETH Start To Recover
Total assets under management rose for the first time in 4 months, increasing 2.3% to $44.9bn (remaining 39.8% below its all-time high in October).
This increase was consistent across all product types with exchange-traded certificates rising the most, up 17.0% month-on-month, to $3.6bn. The increase in AUM was not localised to any one asset, with both BTC and ETH based products seeing a total rise of 1.7% to $31.2bn, and 4.6% to $11.6bn, respectively.

Average Weekly Net Inflows Reverse Downward Trend
Average weekly net inflows finally reversed their downward trend as it turned positive, averaging $89.9mn in February. Weekly net inflows have been in constant decline since reaching an all-time high in October, when they averaged approximately $465.5mn.
Products have maintained net inflows since the 3rd week of January, with average weekly inflows reaching levels not seen since the first week of December when they averaged $184.1mn.

Save Over £400 With Group #CCDAS Tickets
The CryptoCompare Digital Asset Summit, CCDAS, is returning on 30th March at Old Billingsgate, London. As Europe's flagship institutional summit for digital assets, this is the perfect opportunity to connect with key industry decision-makers and leading names in finance who are adopting and embracing the digital asset revolution.
Due to popular demand, we have now launched group tickets for CCDAS! This includes 4 x general admission tickets and saves you over £400! Check out the link for details on ticket inclusions: https://summit.cryptocompare.com/tickets

CryptoCompare Index Products
The MVIS CryptoCompare Digital Assets Indices family tracks the financial performance of the largest and most liquid digital assets and serves as the underlying platform for financial products globally. See all available indices here. Get in touch to learn more about how our indices can help you build innovative products.
The MVIS CryptoCompare Digital Assets Indices can be licensed to clients for a variety of purposes, including:
- Performance measurement and attribution
- Investment product development, as the basis for structured products such as ETPs and futures contracts
- Asset allocation
- Research
Contact CryptoCompare to learn how our indices can help you.


