Bitcoin and Ethereum fell 23.3% and 36.9% respectively in January (data up to 27th) as the majority of digital assets continued to decline from the all-time highs that were reached in early November.
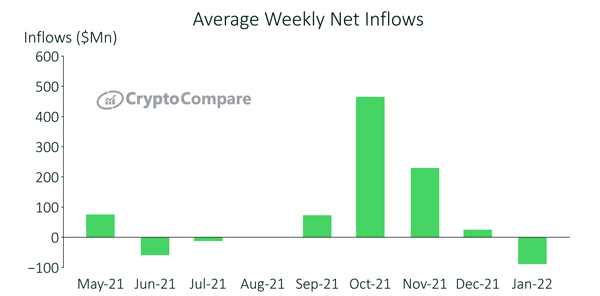
Digital asset investment products also experienced outflows for the first time since August, with weekly outflows averaging $88m in January following rising inflation in the U.S.
Access CryptoCompare's latest Digital Asset Management Review for all the latest insights.
Key takeaways:
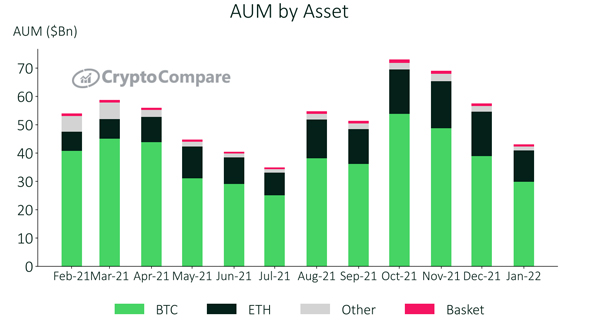
- Total AUM for all aggregate exchange and OTC-traded products has fallen to $43.9bn, a decrease of 25.1% since December and an even further decline from the high of $74.7bn in October. Bitcoin products AUM decreased 23.3% (to $29.9bn), while Ethereum saw a larger decline of 29.2% (to $11bn).
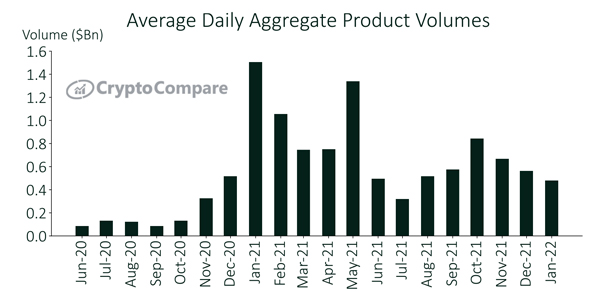
- Average daily trading volume fell in line with AUM again in January, falling 14.5% to $481mn. VanEck’s VETH and Grayscale’s ETHE Ethereum products saw the largest decrease, down 38.9% (to $3.91mn) and 34.8% (to $139mn) respectively.
- January 2022 has been the first month to average weekly outflows since August 2021. Average weekly outflows reached $88mn with a record $207mn of outflows in the first week of January – the highest outflows since the first week of June ($238mn).
- Bitcoin products experienced the largest outflows with a weekly average of $49.3mn, followed by Ethereum products with an average of $28.2mn. Solana products saw the largest inflows with a weekly average of $2.4mn.
ETH-Based Products Lead Third Consecutive Month of Sell-Offs
In January, Bitcoin’s AUM fell 23.3% to $29.9bn. However, it gained market share from December (now 69.5% of total AUM vs. 67.8% last month). Ethereum’s AUM also fell 29.2% to $11.0bn while Other and Baskets’ AUM were $1.5bn (down 29.9%) and $673mn (down 24.1%) respectively.

Average Weekly Flows Turn Negative in January
Average weekly net inflows were negative in January for the first time since August 2021. Outflows averaged $88.3mn, a decrease from $43.3mn in December.

Digital Asset Trading Volumes Tumble
Aggregate daily volumes across all digital asset investment product types fell by an average of 14.5% from December to January. Average daily volumes now stand at $481mn.

The MVIS CryptoCompare Digital Assets Indices can be licensed to clients for a variety of purposes, including:
- Performance measurement and attribution
- Investment product development, as the basis for structured products such as ETPs and futures contracts
- Asset allocation
- Research


