


BISX is pleased to announce its BISX All-Share Index and trading statistics for the twelve-month period ending December 31, 2019 with comparison to the same period of 2018.
BISX ALL SHARE INDEX
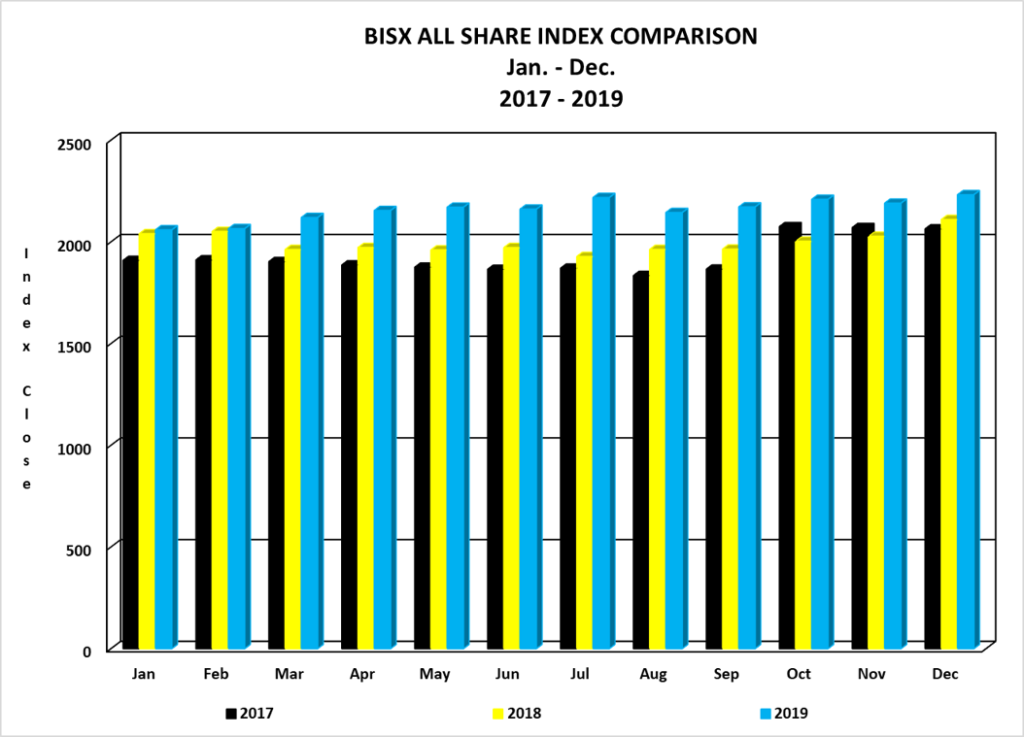
For the twelve-month period ending December 31, 2019 the BISX All-Share Index closed at 2,231.60. This represents a year to date increase of 122.19 or 5.79%. By comparison for the twelve-month period ending December 31, 2018 the BISX All-Share Index closed at 2,109.45. That increase was a year to date increase of 45.88 or 2.22%. The BISX All-Share Index is a market capitalization weighted index comprised of all primary market listings excluding debt securities.
As at December 31, 2019 the market was comprised of 19 ordinary shares with a market capitalization of $4.77 Billion. In addition, there were 7 preference shares with a market capitalization of $244 Million and 12 bonds with a face value of $507 Million.
MARKET CAPITAL
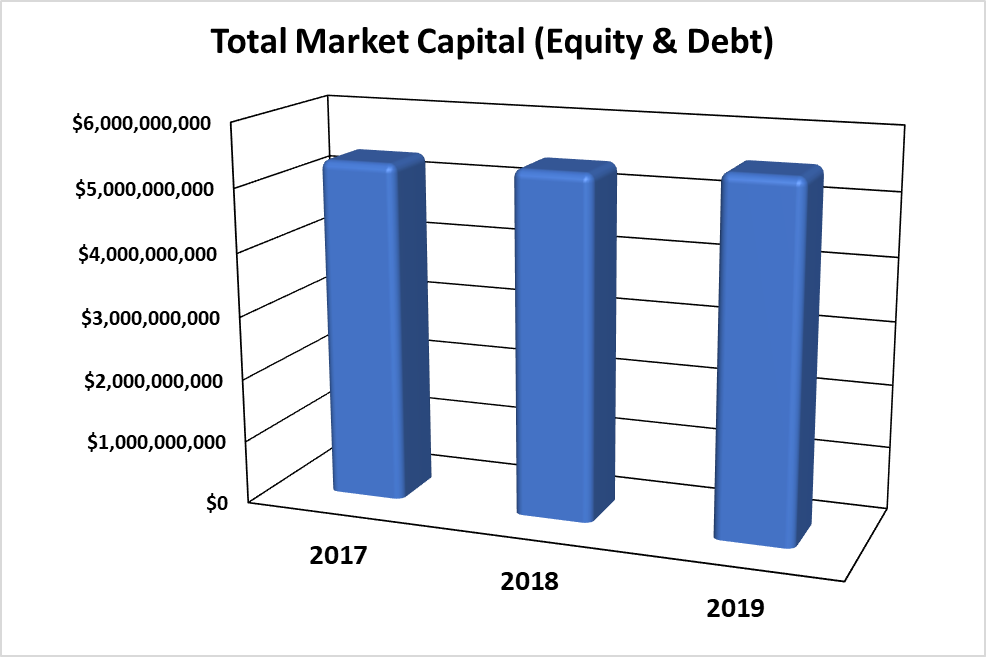
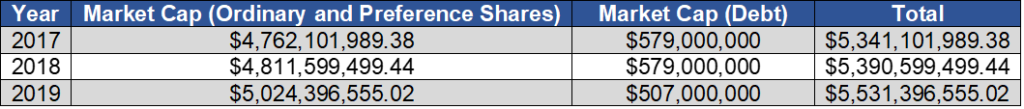
Over the 3-year period 2017 to 2019, the market value of all securities listed on BISX has shown an increase from 2017 to 2019 as indicated by the chart below:
COMPARISON OF BISX ALL SHARE INDEX TO INTERNATIONAL INDICES
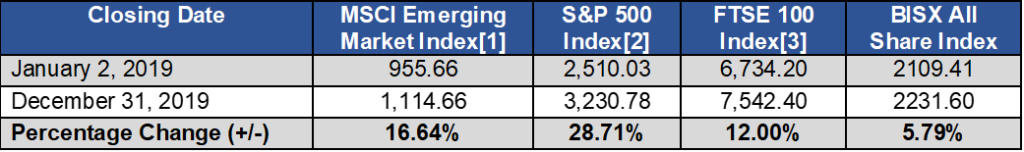
Over the 12-month period January 2 to December 31, 2019, some international equity markets have experienced decreases as indicated by the chart below:
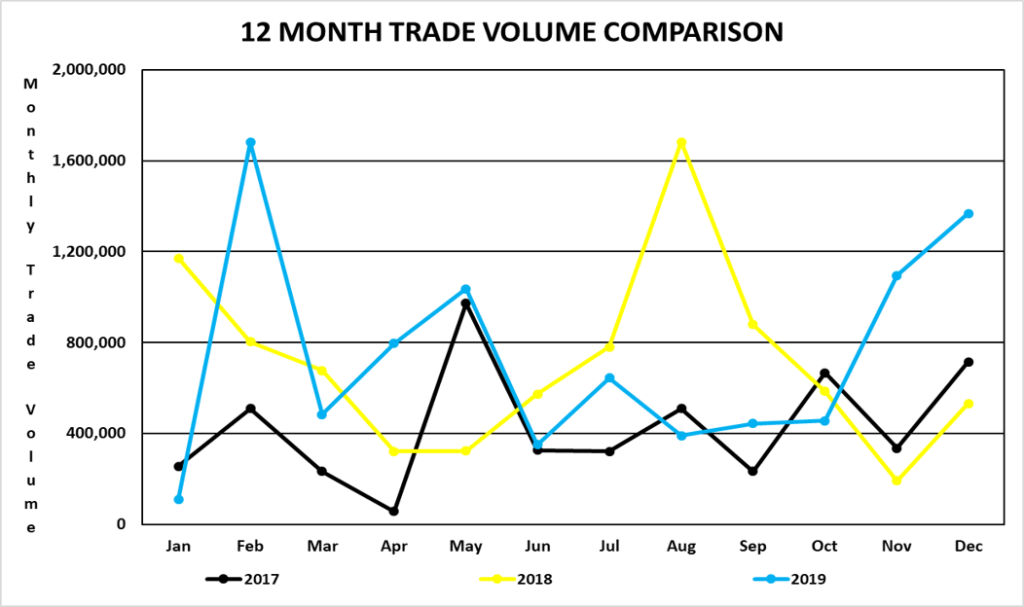
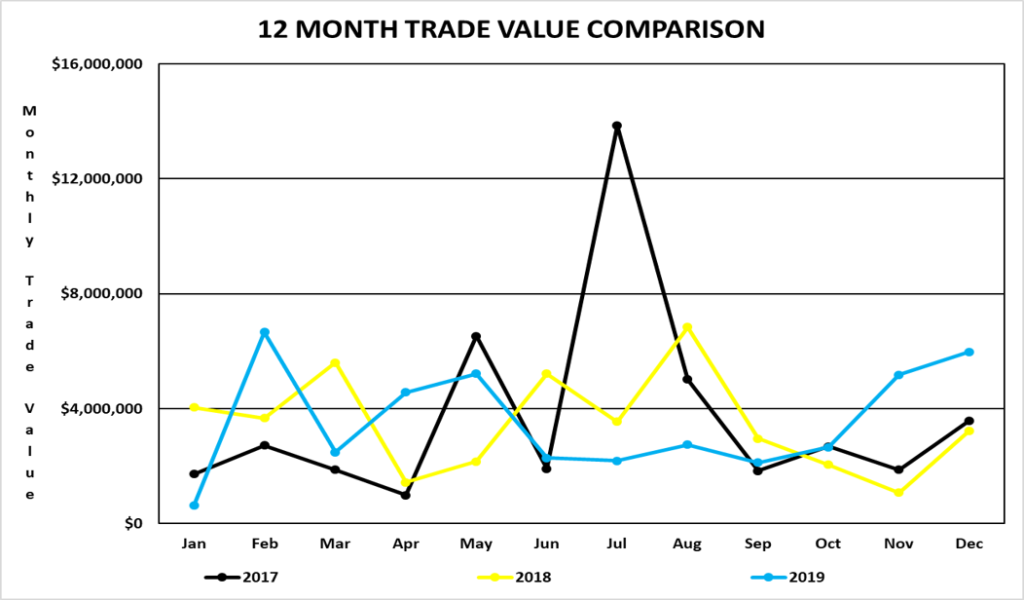
TRADING VOLUMES AND VALUES
Trading volume for the twelve-month period January 2, 2019 to December 31, 2019 was 8,853,345 shares for a value of $42,745,590.47. Trading volume for the twelve-month period January 2, 2018 to December 31, 2018 was 8,519,711 shares for a value of $41,832,862.36.
Trading volume for the three-month period October 1 to December 31, 2019 was 2,919,089 shares for a value of $13,818,345.31. By comparison, for the three-month period from October 1 to December 31, 2018 was 1,308,443 shares for a value of $6,352,247.50.
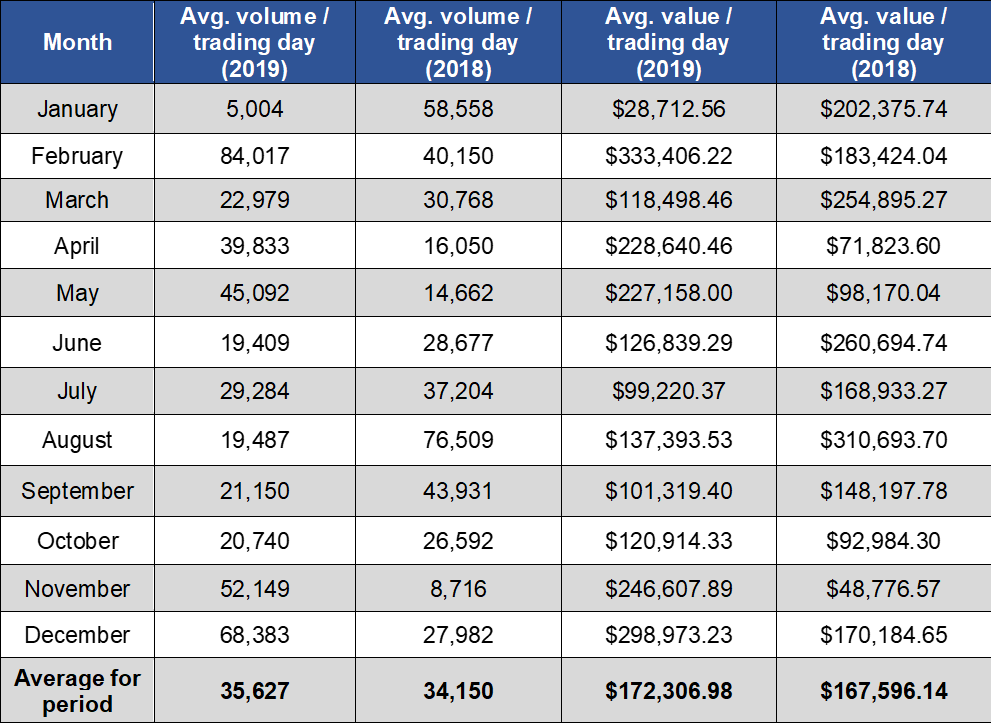
AVERAGE DAILY VOLUME AND VALUE
For the twelve-month period ending December 31, 2019, the average daily trading volume was 35,627
shares which resulted in an average daily trading value of $172,306.98. By comparison for the twelve-month period December 31, 2018 the average daily trading volume was 34,150 shares for an average value of $167,596.14.
During the three-month period from October 1, 2019 to December 31, 2019, the average volume per trading day was 47,091 shares for a value of $222,165.15. By comparison, for the three-month period from October 1, 2018 to December 29, 2018, the average volume per trading day was 21,097 shares for an average value of $103,981.84.
SHARE VOLUME AND VALUE LEADERS (TWELVE MONTH PERIOD)
The top five share volume leaders on BISX for the twelve-month period January 2, 2019 to December 31, 2019 with their contribution to total traded volume displayed as a percentage were:
| SYMBOL | TRADE VOLUME | % OF VOLUME |
| CBL | 2,793,770 | 31.6% |
| FCL | 2,126,469 | 24.0% |
| AML | 801,842 | 9.1% |
| CAB | 737,801 | 8.3% |
| DHS | 520,772 | 5.9% |
The top five share value leaders for the twelve-month period January 2, 2019 to December 31, 2019 with their contribution to total traded value displayed as a percentage were:
| SYMBOL | TRADE VALUE | % OF TRADE VALUE |
| CBL | $12,016,478 | 28.1% |
| FCL | $6,977,650 | 16.3% |
| FBB | $5,211,044 | 12.2% |
| AML | $3,060,669 | 7.2% |
| CAB | $2,288,126 | 5.4% |
SHARE VOLUME AND VALUE LEADERS (THREE MONTH PERIOD)
The top five share volume leaders on BISX for the three-month period October 1, 2019 to December 31, 2019 with their contribution to total traded volume displayed as a percentage were:
| SYMBOL | TRADE VOLUME | % OF VOLUME |
| CBL | 938,897 | 32.2% |
| FCL | 809,328 | 27.7% |
| AML | 345,650 | 11.8% |
| DHS | 285,390 | 9.8% |
| CAB | 176,063 | 6.0% |
The top five share value leaders for the three-month period October 1, 2019 to December 31, 2019 with their contribution to total traded value displayed as a percentage were:
| SYMBOL | TRADE VALUE | % OF TRADE VALUE |
| CBL | $3,925,594.04 | 28.4% |
| FCL | $2,692,465.62 | 19.5% |
| FBB | $1,364,349.80 | 9.9% |
| AML | $1,233,455.00 | 8.9% |
| DHS | $1,136,567.90 | 8.2% |

