


ETFGI, a leading independent research and consultancy firm covering trends in the global ETF/ETP ecosystem, reported today that ETFs and ETPs listed Globally gathered net inflows of US$45.94 billion in March, bringing year-to-date net inflows to US$145.74 billion. Assets invested in the Global ETF/ETP industry finished the month up 3.2%, from US$5.4 trillion at the end of March, to US$5.57 trillion, according to ETFGI's April 2019 Global ETF and ETP industry landscape insights report, an annual paid-for research subscription service. (All dollar values in USD unless otherwise noted.)
Highlights
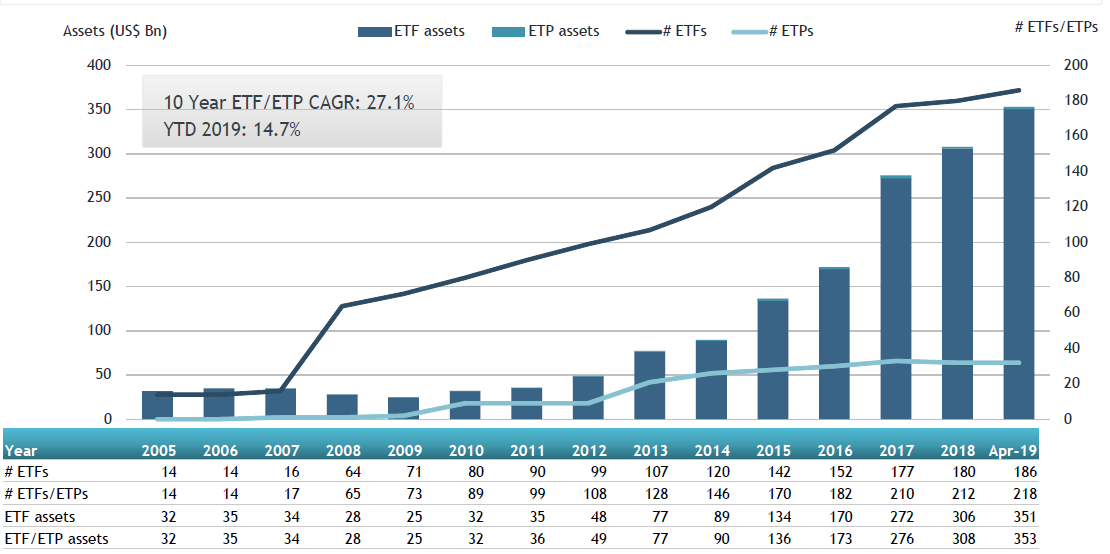
- Assets invested in the Global ETF/ETP industry reach a new record US$5.57 Tn.
- Assets invested in the Global ETF/ETP industry increased 3.2% in April.
- During April 2019, ETFs/ETPs listed Globally attracted $45.94 Bn in net inflows.
- 63 consecutive months of net inflows into ETFs/ETPs listed globally.
“Markets appear to have returned to the relative calm they had grown accustomed to over the past few years. Returns for developed indices were higher in April compare to March. The S&P 500 finished April up 4.05%, with year-to-date returns of 13.7%, marking its best quarter since ‘09. The S&P Europe 350 fell -1.42% in March, as economic data from the region continues to send mixed signals, bringing year-to-date returns to 11.85%. The Topix 150 in Japan was up 1.14% in April, bringing year-to-date returns of 3.77%. Emerging & Frontier returns continued to outpace developed markets. The S&P Emerging BMI and Frontier BMI finished March up 1.11% and -0.87%%, bringing year to date returns to 6.12% and 9.87%, respectively.” according to Deborah Fuhr, managing partner and founder of ETFGI.
At the end of April 2019, the Global ETF/ETP industry had 7,774 ETFs/ETPs, from 412 providers listed on 71 exchanges in 58 countries. Following net inflows of $45.94 Bn and market moves during the month, assets invested in the Global ETF/ETP industry increased by 3.2% from $5.4 Tn at the end of March, to $5.57 Tn.
Growth in Global ETF and ETP assets as of the end of April 2019
Equity ETFs/ETPs listed Globally attracted net inflows of $34.74 Bn in April, bringing net inflows for 2019 to $71.04 Bn, substantially less than the $116.54 Bn Mn in net inflows equity products had attracted by the end of April 2018. Fixed income ETFs/ETPs listed Globally attracted net inflows of $12.35 Bn in April, bringing net inflows for 2019 to $68.62 Bn, considerably greater than the $33.62 Bn in net inflows fixed income products had attracted by the end of April 2018.
Substantial inflows can be attributed to the top 20 ETF's by net new assets, which collectively gathered $33.82 Bn in March, the SPDR S&P 500 ETF Trust (SPY US) gathered $5.01 Bn alone.
Top 20 ETFs by net new assets April 2019: Global
|
Name |
Ticker |
Assets |
NNA |
NNA |
|
SPDR S&P 500 ETF Trust |
SPY US |
282,427 |
908 |
5,050 |
|
iShares 20+ Year Treasury Bond ETF |
TLT US |
13,091 |
4,097 |
3,259 |
|
Nikkei 225 Exchange Traded Fund |
1321 JP |
59,067 |
3,807 |
3,100 |
|
iShares Core S&P 500 ETF |
IVV US |
176,763 |
3,250 |
2,668 |
|
iShares Core MSCI EAFE ETF |
IEFA US |
64,191 |
4,840 |
2,213 |
|
Invesco QQQ Trust |
QQQ US |
76,072 |
1,077 |
1,903 |
|
Financial Select Sector SPDR Fund |
XLF US |
25,742 |
(1,013) |
1,834 |
|
Reliance CPSE ETF |
CPSEBE IN |
6,137 |
1,534 |
1,534 |
|
iShares US Treasury Bond ETF |
GOVT US |
9,906 |
2,876 |
1,287 |
|
JPMorgan BetaBuilders Canada ETF |
BBCA US |
3,737 |
1,359 |
1,272 |
|
Vanguard S&P 500 ETF |
VOO US |
113,277 |
6,469 |
1,225 |
|
SPDR Dow Jones Industrial Average ETF |
DIA US |
22,459 |
67 |
1,087 |
|
TOPIX Exchange Traded Fund |
1306 JP |
81,787 |
5,003 |
1,065 |
|
Vanguard Total Stock Market ETF |
VTI US |
114,102 |
3,536 |
1,005 |
|
JPMorgan BetaBuilders Europe ETF |
BBEU US |
4,325 |
1,354 |
1,003 |
|
Listed Index Fund TOPIX |
1308 JP |
36,856 |
2,598 |
976 |
|
iShares Core U.S. Aggregate Bond ETF |
AGG US |
59,985 |
1,630 |
920 |
|
iShares € High Yield Corp Bond UCITS ETF |
IHYG LN |
7,587 |
1,911 |
837 |
|
First Trust Utilities AlphaDEX Fund |
FXU US |
1,206 |
786 |
805 |
|
iShares 7-10 Year Treasury Bond ETF |
IEF US |
13,434 |
3,058 |
781 |

The top 10 ETP's by net new assets collectively gathered $1.63 Bn in March. Invesco Gold ETC (SGLD LN) gathered $337 Mn.
Top 10 ETPs by net new assets March 2019: Global
|
Name |
Ticker |
Assets |
NNA |
NNA |
|
Invesco Gold ETC |
SGLD LN |
5,456 |
523 |
337 |
|
VelocityShares Daily 2x VIX Short Term ETN |
TVIX US |
897 |
1,082 |
275 |
|
ProShares Ultra VIX Short-Term Futures |
UVXY US |
647 |
799 |
219 |
|
VelocityShares Daily 3x Long Natural Gas ETN |
UGAZ US |
491 |
380 |
209 |
|
iPath Series B S&P 500 VIX Short-Term Futures ETN |
VXXB US |
846 |
905 |
195 |
|
Xtrackers Energy Booster Euro Hedged ETC |
XCTH GY |
136 |
133 |
132 |
|
ETFS Copper |
COPA LN |
246 |
60 |
72 |
|
VelocityShares 3x Inverse Crude Oil ETN |
DWT US |
159 |
186 |
69 |
|
ProShares VIX Short-Term Futures ETF |
VIXY US |
239 |
193 |
63 |
|
Large Cap Growth Index-Linked Exchange Traded Notes due 2028 |
FRLG US |
822 |
243 |
57 |
Investors have tended to invest in large cap equity/fixed income ETFs in April.


